Teghwin Kohli
McGill University
Business Analytics and Marketing
Welcome to my data analytics portfolio! Here, you'll find a collection of projects showcasing my skills in data analysis, optimization, modeling, and visualization. Each project includes a brief description, data and methods used, and insights obtained. Click on each project to learn more or get in touch if you have any questions!
Data Analytics Portfolio
1. Understanding Risk Factor in Automobile Insurance using Random Forests
Tools used: R Studio, Random Forests, Gradient Boosting, Principal Component Analysis (PCA), K-Clustering, GG Plot
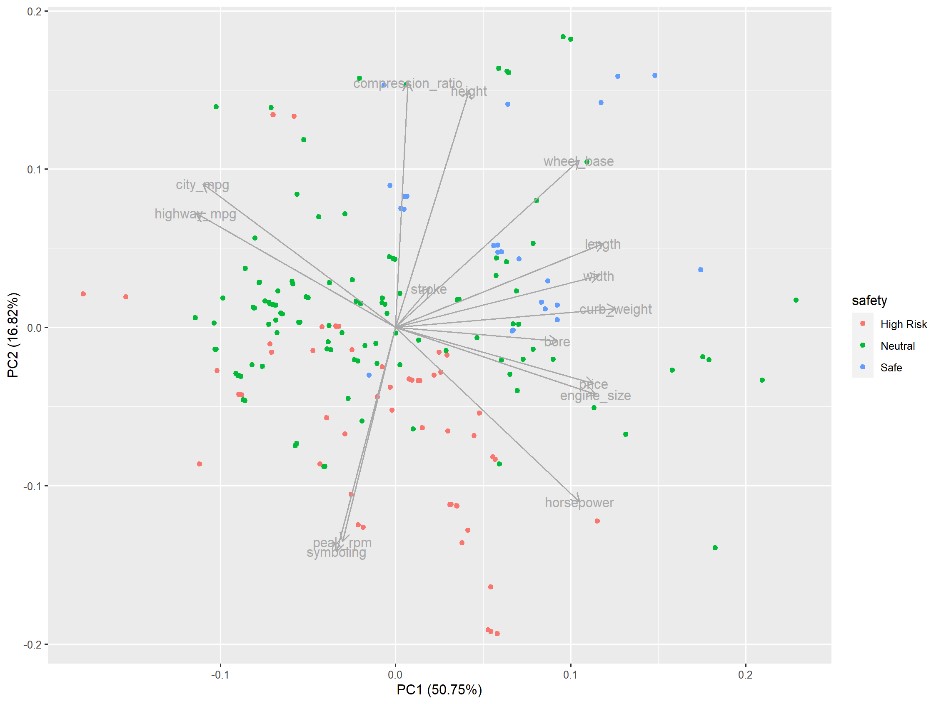
Insurance companies continuously seek ways to evaluate the risk of insuring various vehicles accurately. This enables them to set reasonable premiums and guarantee coverage for potential losses. This study presents a statistical analysis utilizing machine learning to forecast the risk rating of automobiles based on their attributes. Specifically, it examines the impact of a car’s specifications on the assigned insurance risk rating symbol, a crucial aspect in calculating insurance premiums. The analysis not only benefits insurance companies but also informs consumers of the key factors influencing their insurance rates.
2. Mixed Integer Programming to solve Supply-Demand Mismatch for Bike Sharing Service
Tools Used: Python (Jupyter Notebook), Gurobi for Programming, Numpy, MatplotLib
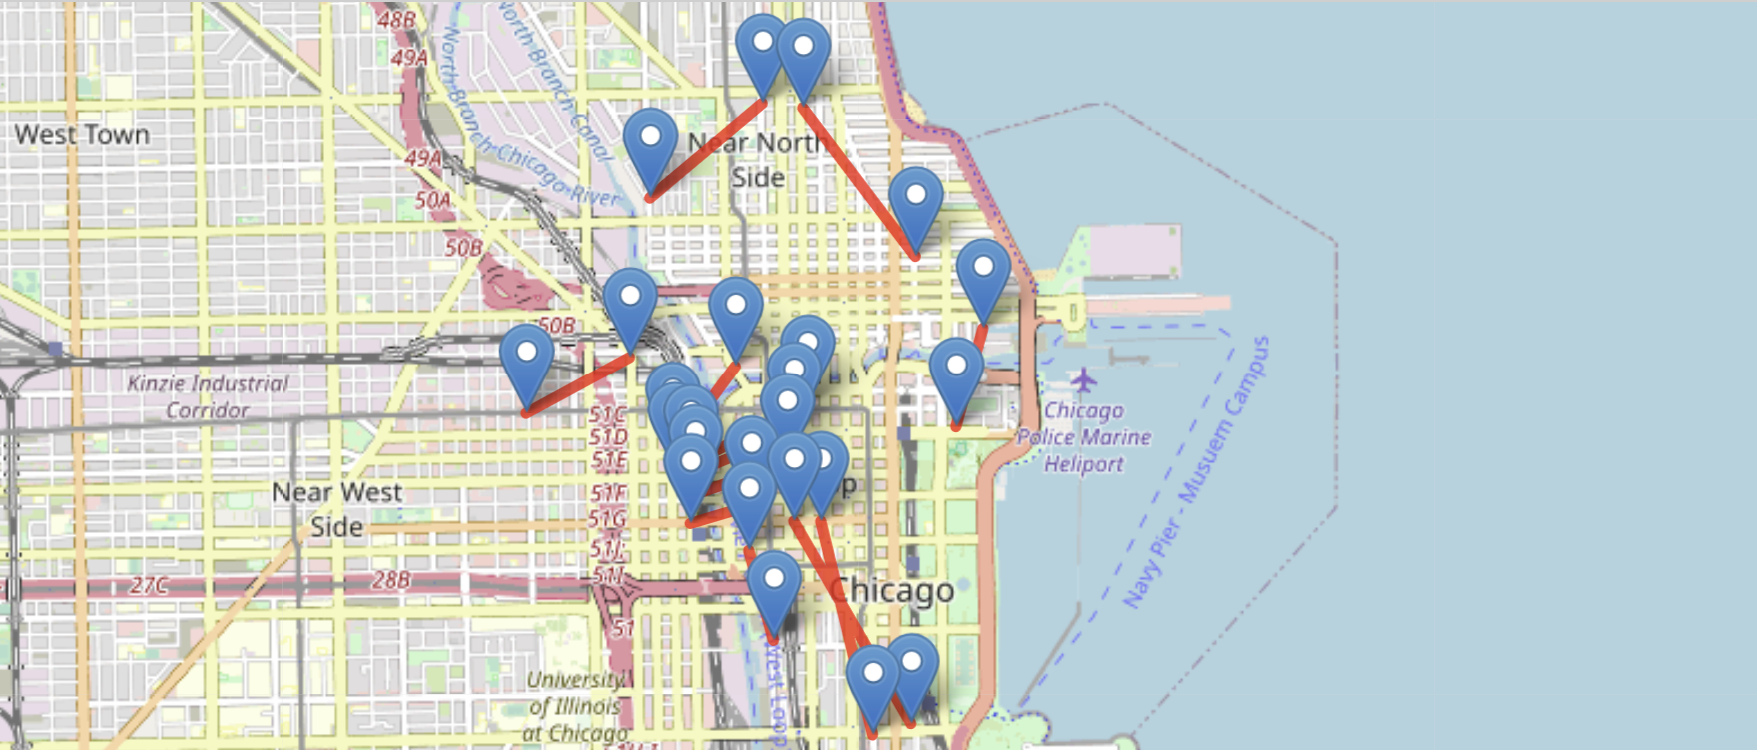
Public bike sharing services often struggle with an imbalanced distribution of bikes among stations throughout the city. This is due to users following specific travel patterns for work, school, or other daily activities, causing high-traffic stations to become full and preventing other users from docking their bikes at their destination. The aim of the project was to create a model that recommends the optimal bike relocation strategy in the city, enabling more customers to use the service. To accomplish this, a mixed integer optimization model was developed to move bikes from low-demand stations to those with relatively higher demand.
3. Social Media Analysis using Image Analytics and Topic Modeling
Tools Used: Python, Google Cloud Vision API, Topic Modeling, Word Frequency, Scraping

GoPro is a top-tier action camera producer that creates its own mobile apps and video editing software. This study aims to analyze GoPro’s Twitter image uploads using Google Cloud Vision API. Twitter tweets were scraped and processed through the API using a Python script. Through topic modeling, each image was categorized into a theme and sorted based on engagement metrics. The performance of each theme was analyzed, revealing that on average, landscape photos generated higher engagement, while photos related to winter sports or water sports had lower engagement rates.
4. Interactive Dashboard for Sports Management Company
Tools Used: Tableau, Excel
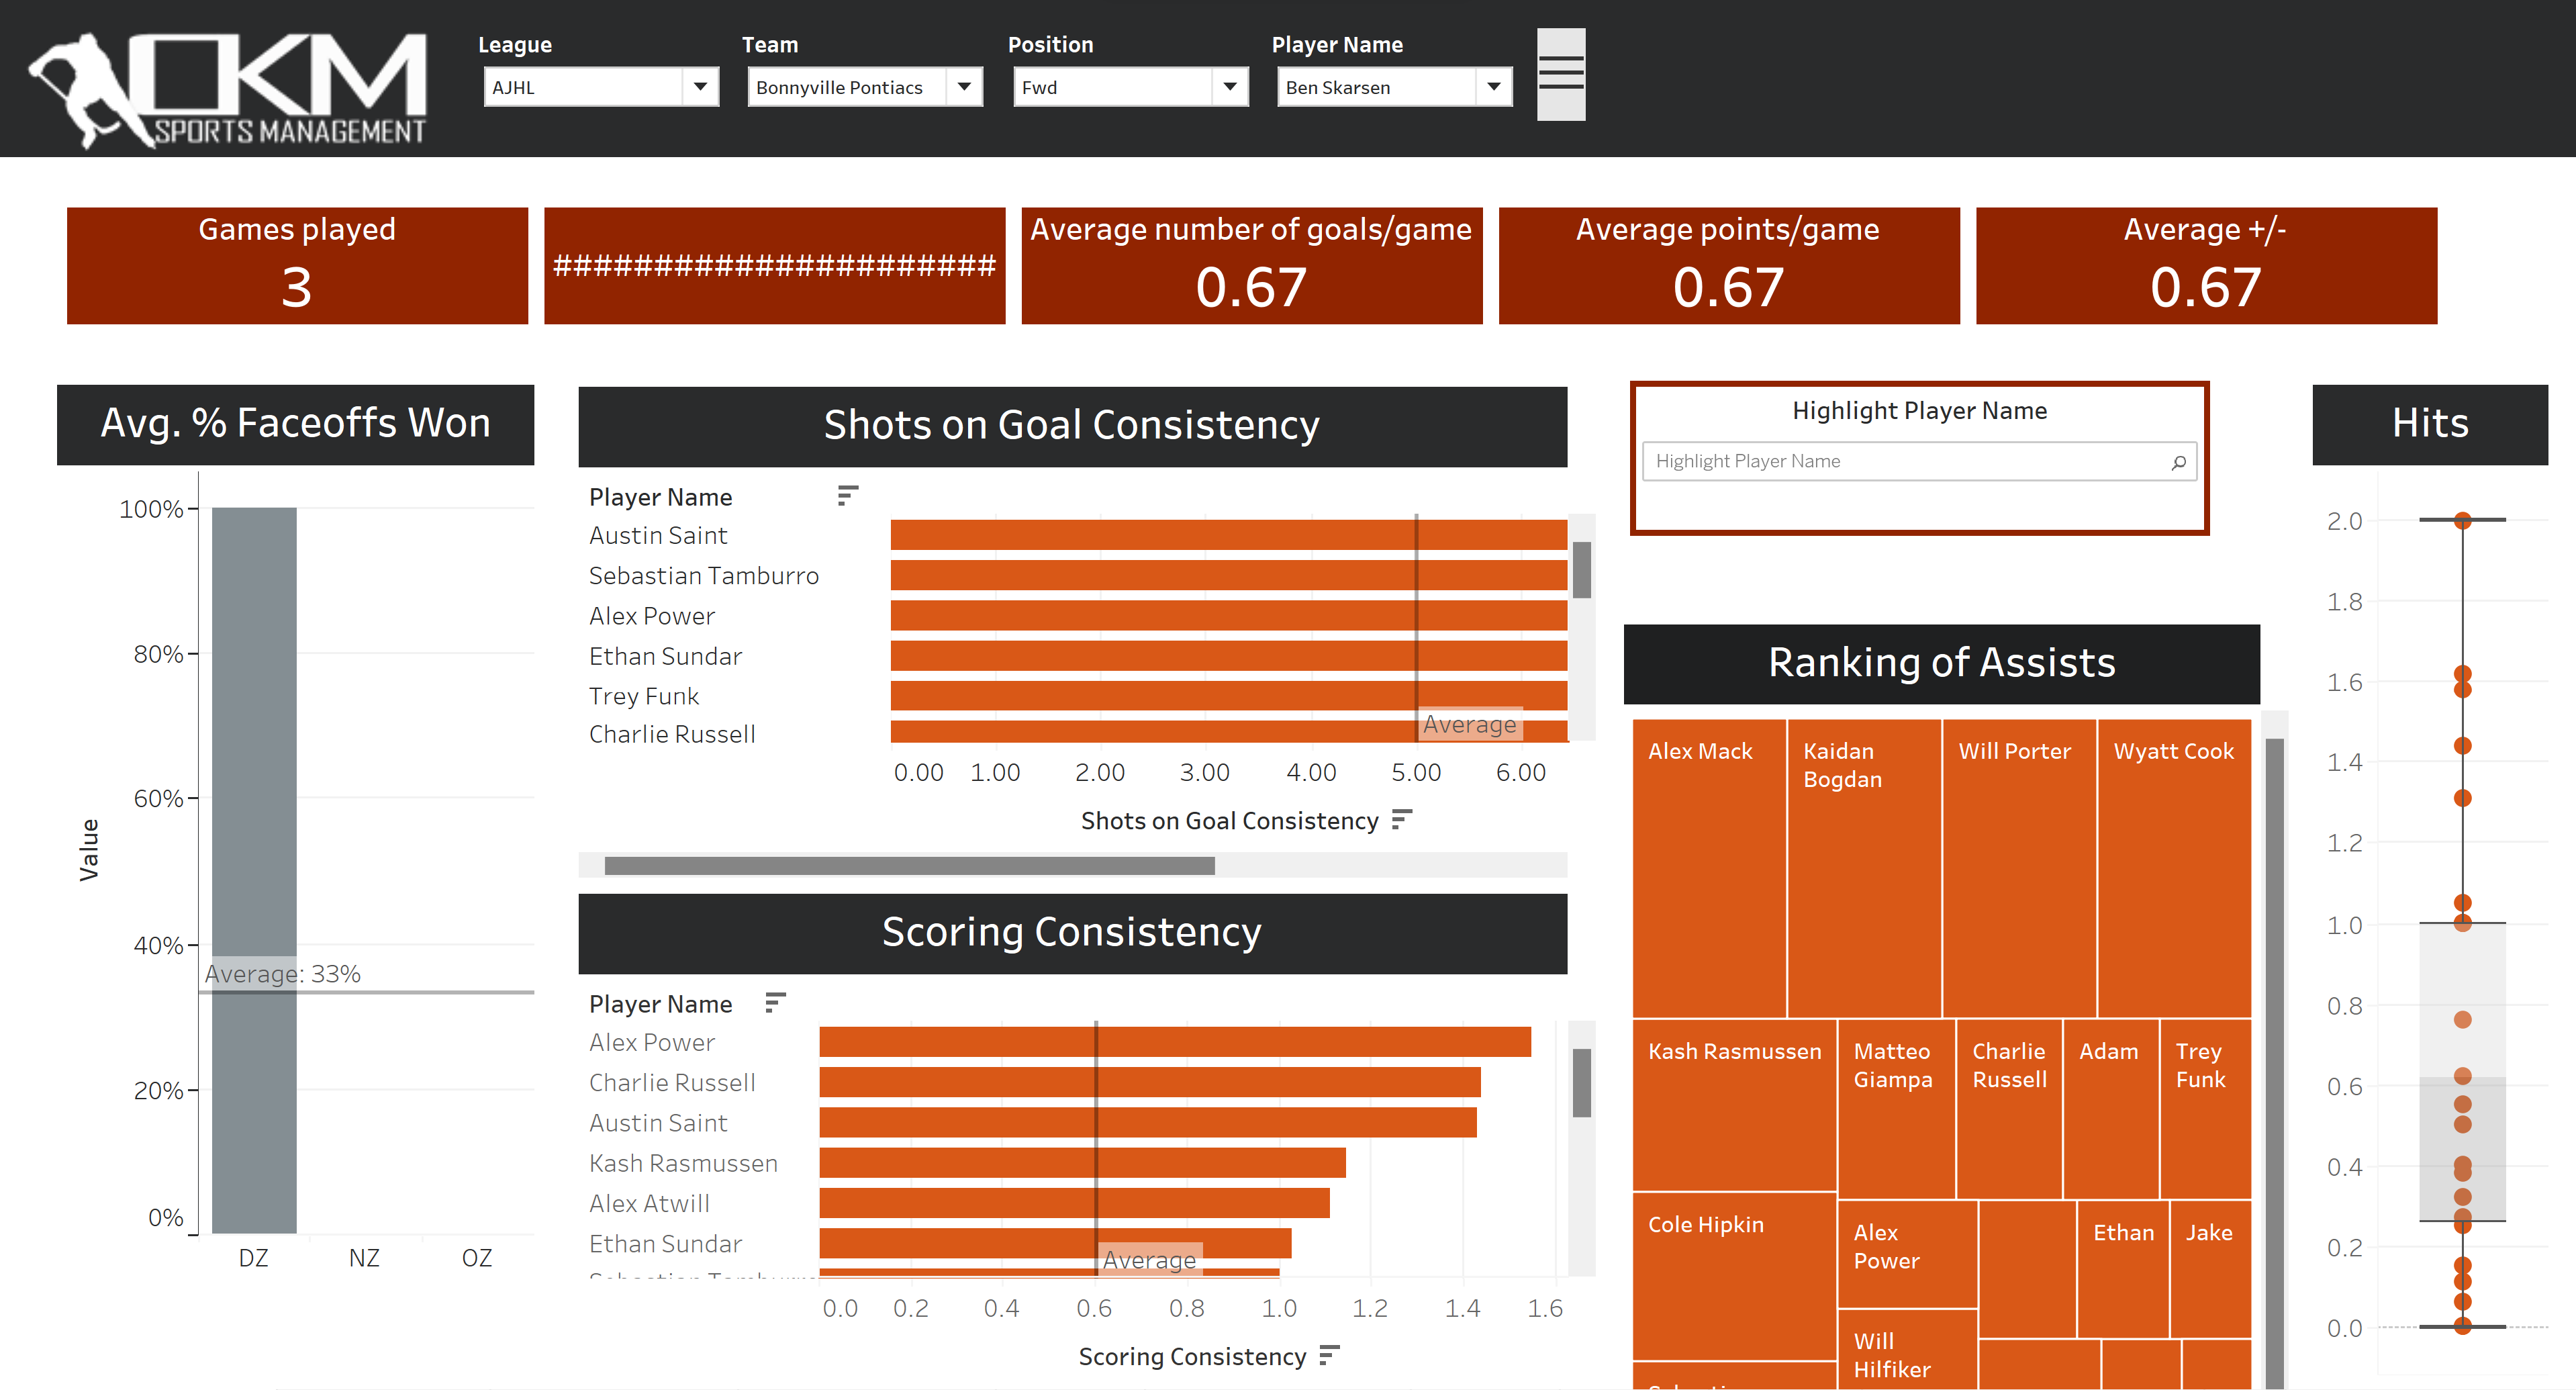
This project employs Tableau to analyze a 7000+ hockey players dataset for CKM, a sports management company. The dashboard helps the company identify high-performing players across 34 hockey teams using boxplots, treemaps, bar charts, and graphs. Interactive filters were created for the company to set performance criteria when signing new players. The dashboard also enables easy retrieval of individual player information and provides an overview of averages. Custom KPIs, such as scoring accuracy and consistency, were added to enhance the analysis.
5. Sentiment Analysis of Fast Fashion Brands using Twitter Data
Tools Used: Python, Text Scraping, Find and Replace, Sentiment Analysis, Word Frequency, Excel
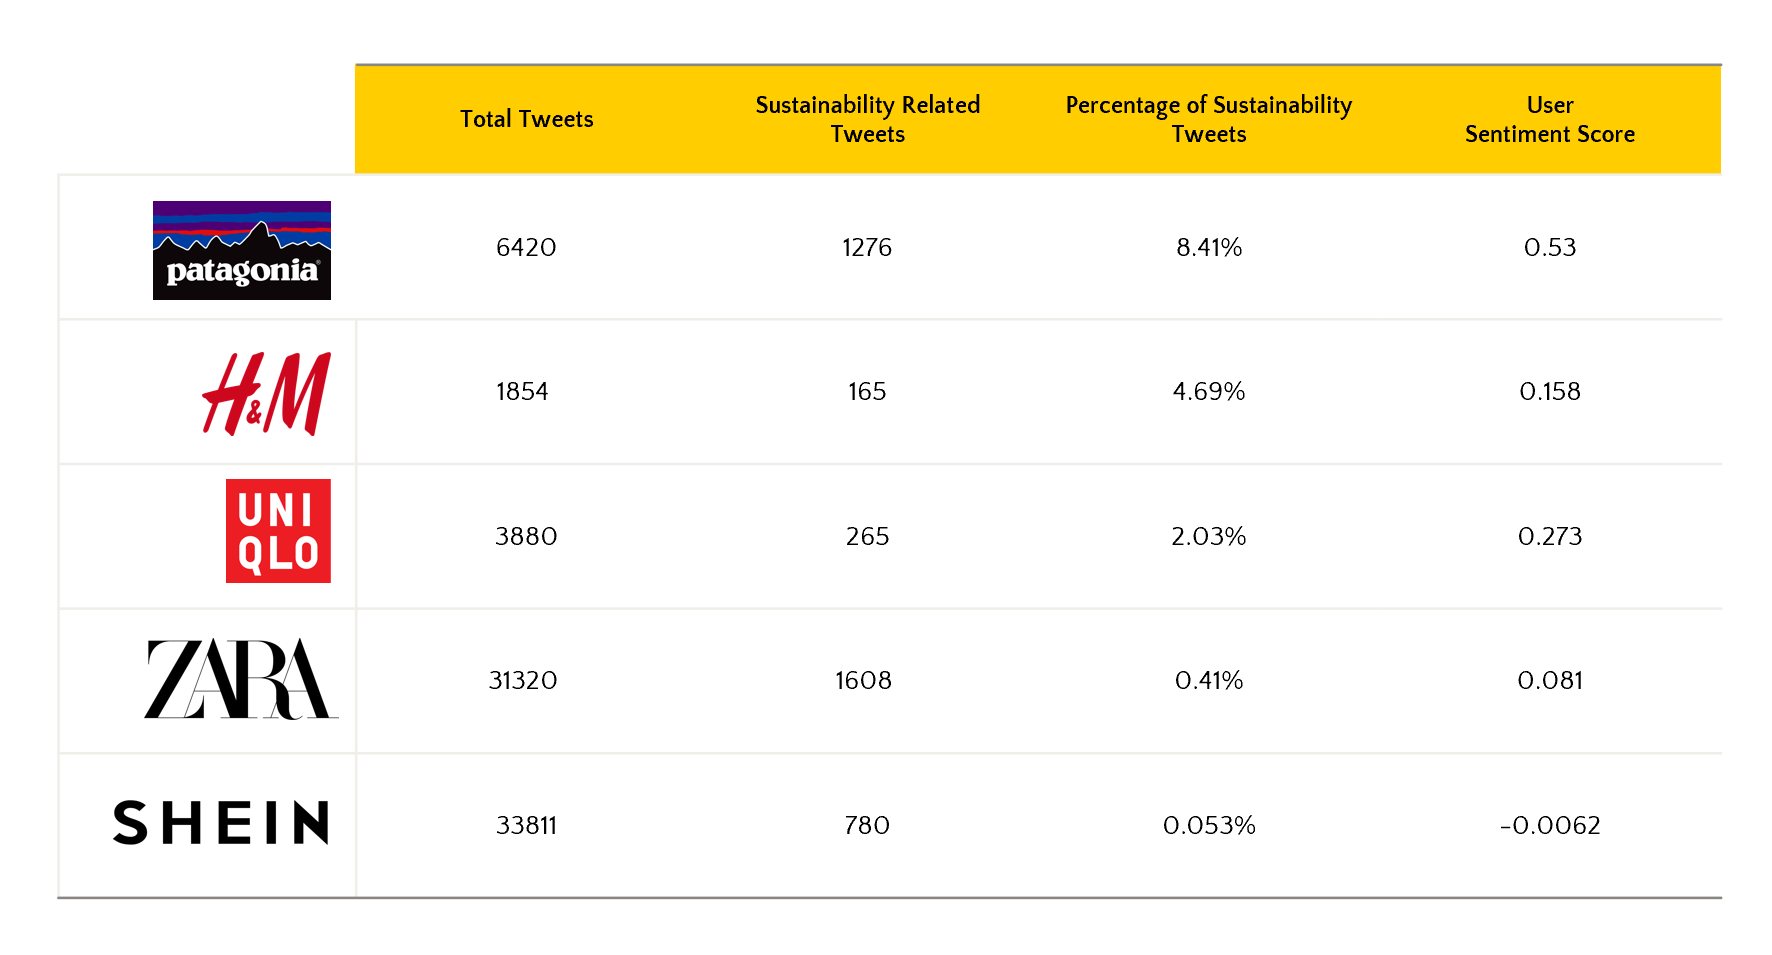
This project conducts a sentiment analysis of company and user tweets on the sustainability practices of fast fashion brands. It aims to comprehend consumer sentiment towards a brand’s sustainability and determine if a brand can use social media as a means to measure user sentiment regarding environmental practices. The top fast fashion brands in Canada, H&M, Zara, Uniqlo, and SHEIN, were selected for the analysis and Patagonia, a brand centered on sustainability, was added as a comparison metric.